Wednesday, September 9, 2015

RTL Wide Spectrum Update

Usable wide spectrum displays from RTL dongle receivers down to 5 MHz without an upconverter!


Raydel, CM2ESP, has released a new version of his wide spectrum implementation of the RTL dongle drivers from Osmocom.  In the last post about this in June, we looked at a stacked spectrum output as it appeared on Radio-Sky Spectrograph (RSS). The spectrum in that version obviously did not display even gain over frequency.  Even a single spectrum from the RTL (and other SDRs) has a diminished "gain" at the edges due to the windowing in the FFT process.  This drop off at the edges was quite apparent in these stacked spectra (see below),  Raydel eliminated this problem by using only the central portion of each spectrum,  and then using more spectra in the stack to make up for the omitted slices.


The original RTL Wide Spectrum display showed strong banding due to decreased gain at the band edges.

Raydel's new code has 3 spectrum frequency spans that you may use, 7.68 MHz , 15.36 MHz,  and 30.72 MHz. The correspond to the Narrow, Medium, and Wide in #Scan Bandwidth Mode,  The lowest frequency is specified instead of the central frequency.  You can select from 240 or 480 frequency channels in the RSS output.  Raydel, included a spike filter. The #Output Mode is designated as Power or Voltage.  I am not sure of the math behind this but the Power setting seems to be less sensitive but with more dynamic range than the Voltage setting.  Finally, there is a #Post FFT applied gain parameter that you will need to play with to get the output in the right range for output to RSS.
I made this scan using CM2ESP's new application and a short antenna.  The content does not matter except that it shows significantly less banding than the previous image RTL Wide Spectrum.

The new wide spectrum program (Solar Sweeper) uses an INI file like the following:

#RTL Solar Sweeper RSS Server Config File.
#DON'T MODIFY LAYOUT!!! Change only values.
#Gain of RTL Dongle (eg: 28.0)
49.6
#Scan Lower Frequency in MHz (eg: 20.5)
 17
#Scan Bandwidth Mode (0 is Narrow, 1 is Medium and 2 for Wide)
0
#Rudimentary Spike Filter (0 is OFF, 1 is ON)
0
#Output Mode (0 is Power, 1 is Voltage)
1
#Channels Number (0 for 240; 1 for 480)
0
#Post FFT applied gain (eg: 500)
500


You won't have to manually write to the INI file.  I built a configuration panel for RTL Wide Spectrum,

As with the earlier version, Raydel's new code can use frequencies below 24 MHz with the R820T tuner because we are using the low frequency enabled version of rtlsdr.dll.  With one of my computers I was able to get down to 17 MHz without an upconverter.  On another, I could get lower but I had to max out the tuner gain to see anything. Raydel reports a better result at lower frequencies, though he also uses a high tuner gain. Look at Fig 1. above.  He was able to scan down to 5 MHz without an upconverter,

The stacked spectra do not always give a perfect display.  The RTL receivers are very prone to overload, especially when the tuner gain is set high and of course when strong signals are present.  This can manifest as flaring across the spectrum, so sometimes you will see a given frequency slice that is much brighter across its entire bandwidth  than its neighbors.  Try different gain settings.  You should only be using the maximum tuner gain when you must.

RSS update, requires previous install of RSS.  If you do not have RSS get it here.  Then do the update found at http://radiosky.com/spec/Spectrograph_Update_2_6_1.exe


Everything you need except for the USB drivers is contained in the latest version of RSS.  CM2ESP's application now named SolarSweeper.exe lives in a directory named RTLW below the Spectrograph program directory. After doing the RSS update, go to Options / Radio  and select RTL Wide Spectrum.  Then press the Configure RTLW button to set up the INI parameters.  Click Update and then Start.  As before, you must have the drivers from Zadig to make this work.  You can get those when installing SDR#, a nice app that you will want anyway to work with your dongle. My understanding is that if you are using Windows 10 you will need the latest Zadig drivers. SDR# is useful for actually listening to modulated signals, whereas RSS just displays a spectrum in a way that is useful for doing some radio science.


Saturday, July 25, 2015

How to Talk to Radio-Sky Spectrograph

Solar flare recorded on our very first radio spectrograph at the Lanihuli observatory on Oahu.  This is the ten minute (approx) view.  A more detailed one minute view is also available.  The frequency in MHz is displayed on the right.
Radio-Sky Spectrograph (RSS) was designed specifically to display solar and Jupiter radio spectra. When we (Richard Flagg and I) designed our first HF spectrograph, the FS200 (still operating  more that 10 years later at the Windward Community College Lanihuli Observatory in Hawaii), we  limited ourselves to 200  "channels" or frequencies for each "scan" or "sweep".  We also tried to obtain 10 scans per second.  These parameters were arrived at based on an educated guess as to what we could physically accomplish consistent with goal of seeing Jupiter S and L Bursts in some detail.  The FS200 is a sweeping type spectrograph as opposed to the more modern approach of using an FFT to derive a spectrum from a software defined radio or SDR.  Our system needed to save about 2000 two-byte samples per second.  Although back then this seemed like a lot of hard drive space, today saving a couple hundred megabytes per day is not a big deal.

In live mode, RSS provides two views of the same spectrum with different time scales.  This is useful for seeing the last minute of data and the last 10 minutes of data (depending on the sweep rate). For Jupiter this was optimum for seeing how the storm was progressing overall, and in detail.  It also turned out to be a good compromise for solar activity. We have found it better to have frequency on the Y axis and  time on the X. This is not the usual format for other SDR programs.  We use high frequency at the top in contrast to many scientific displays which chose the opposite convention for some reason I have never understood.

You can measure the slope of any feature on the spectrogram with just a couple of clicks.

Most SDR programs provide very useful waterfall spectral displays, but I only know of one program other than RSS that allows you to save the reduced spectrum data, and I don't think it is out yet.  Most programs provide for saving the entire bandwidth that the SDR is processing, often millions of samples per second.  This is great for communications because you can go back and demodulate any signal in the bandpass from the saved signal, however, it is currently impractical for long periods of time to save that much data. For our radio astronomy purposes, we don't need all of that data unless we want to do some kind of imaging or interferometry.   Within the next couple years RSS is scheduled to provide support for saving files in NASA's CDF format which is a scientific standard. RSS has turned out to be a very practical display and file saving tool for event based radio astronomy.  RSS is free and can be downloaded here.  If using Win 7 or up I suggest you run tRSS as administrator so that Windows doesn't get mad about it writing to the program directory. You can use the program in Client Mode to view live spectra from other RSS users. Unfortunately, the help is minimal and out of date, but there is a group of people working on creating a manual for RSS.

Sold! How do I use RSS with my receiver?


If you want the functionality that RSS provides but you do not have one of the receivers RSS supports, you can send your data to RSS over a TCP connection as long as you format it properly.  This assumes you know how to get reduced spectral data from your receiver (or can reduce the raw data ) and  that you know how to do a little programming in Python, Java, VB, or whatever.

Your program must act as a TCP server and listen for a connection on port 8888 of the loopback address 127.0.0.1.   Configure RSS under Options /Radio to RTL Bridge / TCP. When you press the Start Button in RSS, it will attempt to connect to your custom software server. Your program should accept the connection and send this string back to RSS:

"F " & CenterFrequencyHertz & "|" &"S "& BandwidthHertz & "|" & "O " & OffsetHertz & "|" & "C " & NumberOfChannels & "|"

For example: F 21000000|S 5000000|O 0|C 500

This would tell RSS that the center frequency of the observation is 21 MHz.  The bandwidth is 5 MHz, so the display will run from 21 + 2.5 to 21 - 2.5 MHz,  or 18.5 MHz to 23.5 MHz. The O is for the offset and is useful for when a downconverter is used.  Here O is set to zero.  Finally, C denotes the number of channels.  This is currently limited to 100 - 512 channels. Each of these parameters is separated by the pipe symbol "|".

The data itself is in two byte binary format.  Each sample is sent as a binary word with LoHi byte order and should be restricted to 12 bit digitization.  The data is sent with the highest frequency first, descending to the lowest.  At the end of each sweep two FE hex bytes (254 decimal) are sent. and the next sweep begins. There are no timestamps.  RSS keeps track of the time and assumes an even sweep rate.

If you run into trouble just contact me at radiosky (at) radiosky (dot) com.  or via the comments. I would love to know if you write something that can send your spectra for display to RSS. Perhaps, you would like to share it with others.


Thursday, July 16, 2015

Charting Power from a RTL Dongle


Its been a while now since I wrote RTL Bridge and made it possible to pipe the total power from the receiver bandpass to Radio-SkyPipe (RSP) for display in a strip chart.  It occurred to me that I had never tested this in any more than a very superficial way.  If it works in some predictable way, then the dongle-RSP combo might be useful for making power measurements.  I even had a use for it, to measure the insertion loss of an inexpensive FM band trap at HF. I bought ten of the traps shown below for $0.67 each from MCM Electronics. The front ends of RTL based receivers are wide open (no rf filters) and thus with their limited dynamic range, are susceptible to overload from nearby commercial radio stations. An effective trap can help this problem.


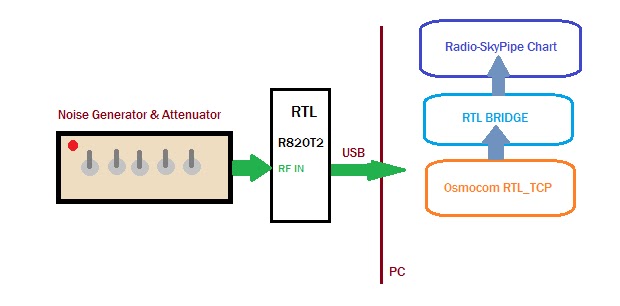
For this and most things, I use the RTL dongles with a 2 MSPS sample rate.  This translates to a 2 MHz wide bandwidth. For this test I have the gain set at maximum for the R820T2 tuner.  The center frequency is 20 MHz which means I am using the low frequency enabled version of the rtlsdr.dll.  I use 20 MHz because I have a noise source calibrated at that frequency (RF2080 C).  I also have a RF2010 noise generator with a built in binary step attenuator capable of  31dB total attenuation.  The noise temperature ranges from about 3000 Kelvin to 3200000 K. 
Basic test setup for determining how well RTL + Radio-SkyPipe can measure rf power.
Basically, the test procedure consisted of warming up the RF2010, and stepping through the binary switches (reversed to put the LSB on the left!) in one dB increments and using the Get Average function in RSP to  average the signal for 10 seconds. I manually wrote down each value on a sheet of graph paper.  The values read from RSP had no real meaning until I would later go back and create an easy straight line equation to relate the raw numbers to the power arriving from the noise generator. Simply calibrate.  What I hoped to see was a plot of a straight line but what I saw was this:

Measured output (Y) are raw values from Radio-SkyPipe.  The X axis is the amount of attenuation in dB removed from the path between the noise source (approx 3.2 million K)  and the RTL dongle receiver with a R820T2 tuner.caption


"Its not linear", I thought. It looks like it has a sinusoidal shape. If tried to find a function that makes the data conform with reality.  I would then apply the function to the incoming data using the RSP Equation feature so that the data would scale to something meaningful like noise temperature or dBm.  Even without calibration, RSP should be able to tell me how much loss incurs from inserting the FM Trap in line to the antenna (or noise source ).

I tried a couple of curve fitting calculators on the web to see if I could get a regression fit of some kind, Unfortunately none of the "curve fitters" made any improvement over a straight line fit. Divergence from my hoped for straight line may on the low end just be due to approaching the HF noise figure limitation of the RTL.  On the high end we may be reaching compression.  There is no filter in line with the 25000K noise source so the input of the dongle is exposed to a very wide band noise signal.

Good Enough

Along the middle 60% there is very good linearity which indicates that Dongle->RTL Bridge->Radio-SkyPipe combo performs well as a power detector at 20 MHz. Below about -93 dBm or 18000K and above -77 dBm or 772000K linearity suffers some. 

So back to the FM Trap insertion loss problem.   The question again is "Will the trap degrade my use of the RTL Dongle at 20 MHz?". So I measured using a noise source with a temperature that laid along the straight part of the line. No need for calibration because we are just interested in a relative measurement. I found the loss of the trap is below the threshold of what I can measure which is about a half dB. That is a totally acceptable loss, provided that the trap is doing what it should do, reduce the signal across FM band 88 - 108 MHz.  I haven't measured the bandpass above and below the FM band but I intend to try.  For kicks I want to use the dongle and a broadband noise source to measure the filter.

Wednesday, June 3, 2015

New Way to Feed Radio-Sky Spectrograph with a Dongle Receiver

One of the limitations of the RTLSDR dongle receivers is that it is hard to get more than about 2.4 MHz of bandwidth  from them.  Raydel Abreu Espinet, CM2ESP,  has written a small Windows application that replaces RTL Bridge by speaking directly to Radio-Sky Spectrograph (RSS) .  What Raydel's software does that RTL Bridge is not capable of is stacking sequential spectra so that you can view a swath of spectrum  even tens of MHz wide.  The program is called RTL-WideSpectrum (RTLW) and does its magic by simply stepping through a number of adjoining spectra and combing their outputs into the modest number of channels permitted by RSS, (512 max). It does this very quickly by working more directly to the RTL dongle than the method used by RTL Bridge ( which uses rtltcp.exe as an intermediary ). 

Above is a RSS spectrogram of a solar burst recorded by Raydel from 28 to 48 MHz.  The horizontal banding is due to the sensitivity roll off at the edges of the 2 MHz band pass of the RTL Dongle.  This can be compensated for to some degree by using the Normalize button in RSS.  I don't know what kind of windowing RTLW is using but there may be some window function that could produce a more even spectrum.

You need to install SDR# and the Zadig driver to use Raydel's app. A Quick Start Guide is available here. Also of course you need RSS which can be downloaded here:  http://radiosky.com/spec/Spectrograph.exe

After installing RSS, you can download and run RTLW. I have placed a copy on my website.  Raydel may wish to put future versions somewhere else. Download and unzip the folder to someplace you can find it.  There is no install procedure.  You might want to create a shortcut to the exe file.

Plug in your dongle and try it out with SDR# first using SDR#'s own drivers.  Once you are satisfied that it is working, run RTL-WideSpectrum.exe from wherever you installed it., 


 At first you need to select a gain and then a frequency correction.  Finally you must select a total spectral width  (5,10,or 20 MHz), and a center frequency for the lowest frequency spectrum.


Run RSS in stand alone mode and select Options /Radio /RTL dongle receiver.  Then press the Start button in RSS  The charts should start scrolling.  If the signal looks too hot, stop the chart and restart RTLW with less gain. I am using 28 for the gain.

  Raydel says that there may be some updates coming and he is aware that there are some things that could be done to make the program easier to use but what he has provided is very workable and probably as effective as you will get using this method to increase the bandwidth of the RTL generated spectra. Obviously, I would love to make RTL Bridge a better performer by using some of Raydel's methods, but I am currently just too busy to work on that project and hope you will enjoy CM2ESP's innovative work.

Monday, March 2, 2015

HF Update to RTL Bridge

Amateur radio astronomer Jim Brown in Pennsylvania recently successfully used a RTL Dongle, Ham-It-Up converter, and a preamp/filter built by Richard Flagg, AH6NM.  Jim said I could use one of the images and here it is below.

Jupiter noise bursts captured by Jim Brown and an RTL Dongle plus RTL Bridge and Radio-Sky Spectrograph software.
I don't want to say too much about Jim's observation as I think he might write it up, but I can say that he was using my software, Radio-Sky Spectrograph (RSS), in conjunction with RTL Bridge.  This proof of concept observation should be encouraging to those who would like to make spectral observations of Jupiter and the Sun using an inexpensive dongle receiver.  Though not as informative as the 10 MHz wide spectrograms we have been seeing in the Radio Jove project, the spectral information does make it easy to identify Jupiter.

Recently I was able to take some time to experiment with Oliver Jowett's  low frequency patch for the Osmocom drivers that allows extending the range of the RTL+R820T below the usual 24 MHz limit without a upconverter or hardware modification.  Using a 2.04 MSPS rate, I was only able to see signals down to about 15 MHz, but many people have reported going much lower.  So while at the time I write this no one has recorded Jupiter with a "naked" dongle, I hope someone will give it a shot soon.  To help push that along I have repackaged RTL Bridge and RSS with the patched drivers.  I have also made a couple of changes to RTL Bridge and RSS.  In RTL Bridge there is now factor that can be used to scale the data appropriately for output.


The new Data Scale Factor is multiplied with the FFT power output before it is passes to RSS.  It was found that this was necessary to get readable deflections in RSS for weak signals.  The other scale factor, now safely tucked into a frame titled Local Display, That factor only affects the display in RTL Bridge and does not alter the data leaving for RSS. 

If you do not have RSS installed, then you can get it here:

http://radiosky.com/spec/Spectrograph.exe

If you have RSS installed and just want the latest updates go to:

http://radiosky.com/spec/Spectrograph_Update_2_4_21.exe

If you are new to this please read the other blog posts I have done on RTL Bridge. You should read the help page  if you have not yet used RTL Bridge.  Please let me know how it works out.


RF Noise Source NF-1000 SZ evaluation

  I have been working on an automated step calibrator project in recent months, so I was excited when I saw the device shown above on eBay. ...